Cardinality of Errors.

This is a slightly updated version of a post I wrote in 2016 on Hatch — Medium’s internal version of Medium. It’s a topic that is still relevant today, even though Observability tooling has come a long way.
When something goes wrong in production, instead of trawling through reams of raw log files, trying to manually pattern match trends, it’s better to reach for something like Kibana, Loki, or AWS’s CloudWatch Insights.
A key feature of these tools is the ability to get aggregated roll-ups of logs, broken down by facets that make up a log message, and filtering in arbitrary dimensions.
Even with structured logs, the content of the error message is one of the primary ways we end off cutting the logs.
What is cardinality?
Cardinality in errors and logs refers to the number of unique values for a specific attribute. High cardinality means many distinct values, while low cardinality have fewer distinct values. Timestamps are an example of high-cardinality data. Status codes are an example of low-cardinality.

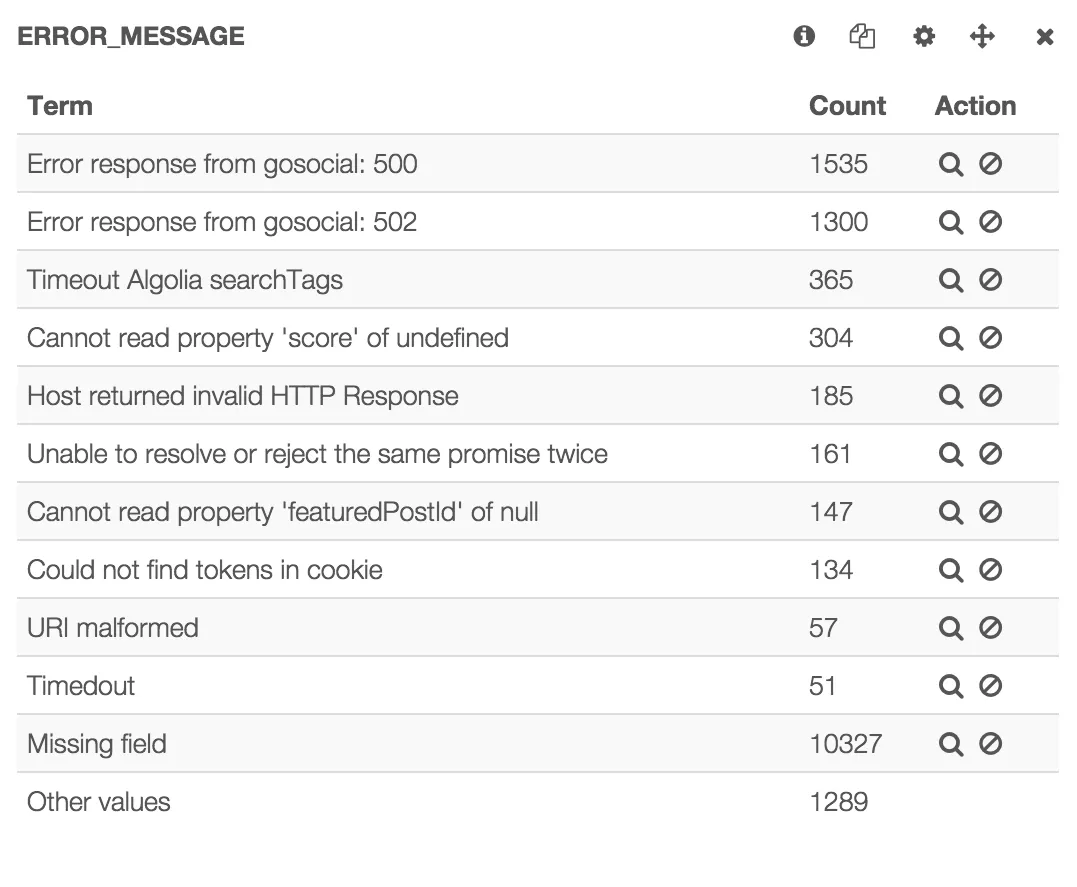
In this screenshot you can see our highest frequency errors. And it’s actually a pretty good example for what this post is about. The top two errors are caused by the same line of code, but because the status code is concatenated, they are grouped separately.
Which, in this case, is actually preferable. It is useful to see Internal Server Error vs. Bad Gateway as they likely indicate different root causes.
However, problems emerge when you unintentionally increase the cardinality of an error message without including useful grouping criteria.
Consider the following:
throw Error('Image is too large: ' + req.body.length)Since there’s a large variation in possible body lengths, you may get hundreds of errors without them ever getting aggregated into a bucket that makes it into the main dashboard.
We actually hit this last weekend. We didn’t notice hanging requests for quite a while, instead we were drowned by 2nd order symptoms. The frequency of the error was low, and because the error string had both the full request URI and parent process’ pid, meant it never got surfaced.
How to handle high cardinality errors
First consider if you can just drop this data.
But if there really is important information that you want added to an error, avoid doing so through concatenation on the message. Instead you can create a custom error with additional properties.
class FancyError extends AbstractError {
  constructor(msg, fanciness) {
    super(msg)
    this.fanciness = fanciness
    this.status = 418
    this.name = 'FancyError'
  }
  toString() {
    return this.message + ': ' + this.fanciness +
        ' is just too fancy!!'
  }
}
When printed to stdout you get the informational message you had before. But when printed to JSON,
for ingestion into the ELK stack, the fields get decomposed such that you can now query on
error_fanciness.
Also note that a lot of useful information is added by default; including timestamp, user id,
client, build, route, handler, transaction id, server, port, pid.
Update for 2024
The above snippet is pretty specific to the Medium stack at that time. These days, every logging
library makes it easy to log fields along with your message. For example, using Go’s new slog
package:
logger.Error("Image is too large", "size", bodySize)If you aren’t always logging errors where they happen, but returning the error to middleware, you can use interfaces to let low-level code propagate additional context for use in logging. This could be generalized:
type AnnotatedError interface {
  Fields() map[string]any
}
Or you could make something more specific to your log package, for instance:
type LoggableError interface {
  LogAttrs() []slog.Attr
}
Then in your middleware do something like this:
func loggingInterceptor(ctx context.Context, req any, info *grpc.UnaryServerInfo, handler grpc.UnaryHandler) (any, error) {
  resp, err := handler(ctx, req)
  if err != nil {
    if lerr, ok := err.(LoggableError); ok {
      slog.LogAttrs(ctx, slog.LevelError, err.Error(), lerr.LogAttrs()...)
    } else {
      slog.ErrorContext(ctx, err.Error())
    }
  }
  return resp, err
}
And finally, if you are logging high-cardinality fields, be careful to understand how your observability tools handle billing.